This btcusd vs ethusd guide is backed by real backtest data. Disclaimer: The information on quant-signals.com is for educational purposes only. It does not constitute financial advice. Backtest results are hypothetical and based on historical data. They do not account for slippage, commissions, spreads, or execution delays. Past performance does not guarantee future results. Trading involves significant risk of loss. Please read our full Disclaimer.
Table of Contents
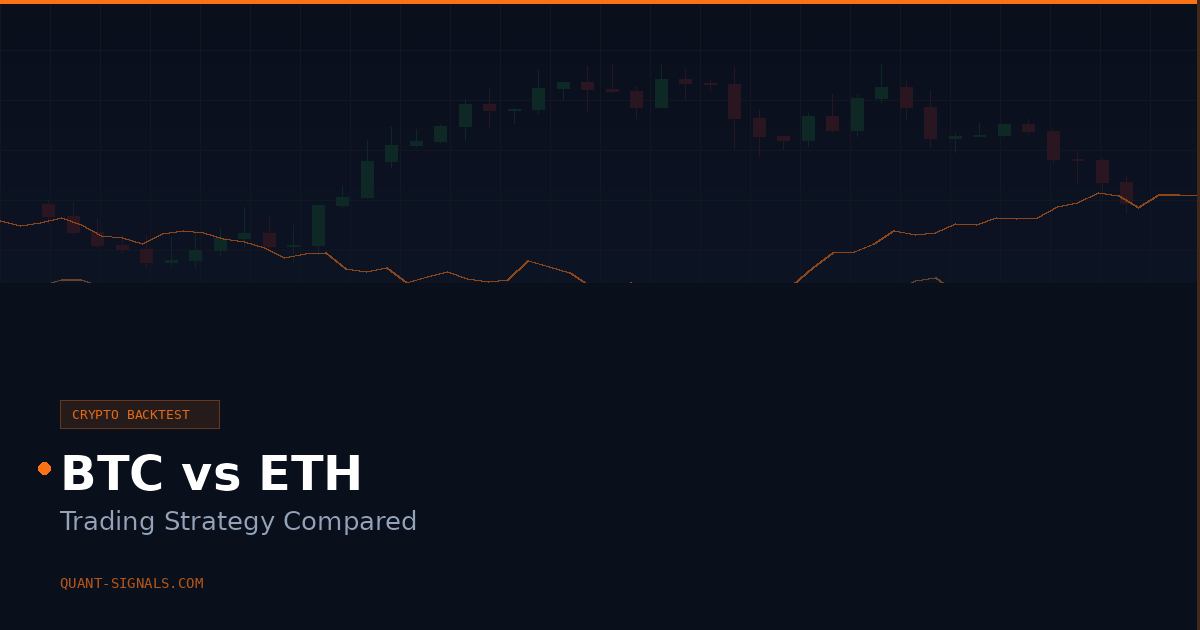
BTCUSD vs ETHUSD — which cryptocurrency is better for trading? We tested both across 4 strategies and 2 timeframes to settle this debate with data, not opinions.
The short answer: BTCUSD has a slight edge across most metrics, particularly for trend-following strategies. But ETHUSD outperforms on volatility breakouts. The best choice for your BTCUSD vs ETHUSD decision depends on your strategy type.
BTCUSD vs ETHUSD: Quick Verdict
| Metric | BTCUSD | ETHUSD | Winner |
|---|---|---|---|
| Best expectancy | +0.667R (EMA Swing D1) | +0.636R (EMA Swing D1) | BTC (barely) |
| Best PF | 2.14 (EMA Swing D1) | 2.08 (EMA Swing D1) | BTC |
| Best Sharpe | 5.25 (EMA Swing D1) | 5.02 (EMA Swing D1) | BTC |
| Best Bollinger result | PF 1.26 (D1) | PF 1.59 (D1) | ETH |
| RSI + Filters H1 | 18.8% WR, -0.438R | 40.0% WR, +0.200R | ETH |
The BTCUSD vs ETHUSD comparison shows Bitcoin winning on trend following while Ethereum wins on mean reversion and volatility strategies.
BTCUSD vs ETHUSD: Full Strategy Comparison
Here’s every strategy tested on both assets, side by side:
| Strategy | TF | BTCUSD | ETHUSD | Winner |
|---|---|---|---|---|
| Bollinger Squeeze Breakout | D1 | +0.157R | +0.328R | ETH |
| Bollinger Squeeze Breakout | H1 | -0.025R | +0.009R | ETH |
| EMA Crossover (9/21) | D1 | +0.330R | +0.114R | BTC |
| EMA Crossover (9/21) | H1 | +0.069R | -0.029R | BTC |
| EMA Swing (21/50) | D1 | +0.667R | +0.636R | BTC |
| EMA Swing (21/50) | H1 | +0.011R | -0.018R | BTC |
| RSI Mean Reversion | D1 | -0.318R | -0.292R | ETH |
| RSI Mean Reversion | H1 | -0.046R | -0.042R | ETH |
| RSI Mean Reversion + Filters | D1 | -0.250R | -1.000R | BTC |
| RSI Mean Reversion + Filters | H1 | -0.438R | +0.200R | ETH |
Where BTCUSD Wins in the BTCUSD vs ETHUSD Battle
Trend following strategies favor Bitcoin. The EMA Crossover strategy on BTCUSD D1 produced our single most reliable positive result in the entire database: 88 trades, PF 1.59, Sharpe 3.49, +0.330R.
Bitcoin’s market structure creates strong, sustained trends driven by institutional adoption cycles, halving events, and macro sentiment shifts. These extended moves are exactly what EMA crossover strategies capture.
The EMA Swing 21/50 variant also performed better on BTCUSD (PF 2.14, +0.667R) versus ETHUSD (PF 2.08, +0.636R), though both had small sample sizes of 22-24 trades.
Partner Broker
Trade These Strategies with IC Markets
IC Markets offers raw spreads from 0.0 pips, fast execution, and MetaTrader 4/5 — ideal for backtested strategies like the ones in this article.
Trading CFDs carries significant risk. 75.93% of retail investor accounts lose money when trading CFDs with this provider.
Where ETHUSD Wins in the BTCUSD vs ETHUSD Battle
Volatility breakouts and filtered mean reversion favor Ethereum. The Bollinger Squeeze Breakout on ETHUSD D1 produced PF 1.59 and +0.328R across 61 trades — significantly better than BTCUSD’s PF 1.26 and +0.157R on the same strategy.
Ethereum’s higher volatility creates more pronounced compression/expansion cycles that Bollinger strategies exploit. ETH also showed positive results with RSI + Filters on H1 (+0.200R, 15 trades) while BTC was deeply negative (-0.438R).
This makes sense: ETH’s price action is more erratic and volatile than BTC’s, creating better conditions for strategies that profit from sharp reversals and volatility expansion.
BTCUSD vs ETHUSD: Volatility Comparison
Ethereum is consistently more volatile than Bitcoin. This affects strategy choice directly:
- Higher volatility = better for breakout strategies (Bollinger Squeeze worked better on ETH)
- Higher volatility = worse for trend following (more noise, more false crossovers on H1)
- Higher volatility = wider stops needed (ATR is proportionally larger on ETH)
When choosing between BTCUSD vs ETHUSD for your trading, consider whether your strategy profits from clean trends (choose BTC) or from volatility expansion (choose ETH).
BTCUSD vs ETHUSD: Which Strategies Work on Both?
EMA variants work on both — trend following produced positive results on BTC and ETH across multiple timeframes and variants. If you want one strategy for both assets, the EMA Crossover 9/21 on D1 is the safest choice.
RSI struggles on both — without filters, vanilla RSI mean reversion was negative on both crypto assets. Even with filters, results were mixed (positive on ETH H1, negative on BTC H1).
Bollinger Squeeze works better on ETH — if you’re trading volatility breakouts, ETHUSD D1 is the better asset in this BTCUSD vs ETHUSD matchup.
The Verdict: BTCUSD vs ETHUSD
The best approach may not be choosing one — it may be trading both with different strategies:
- BTCUSD: Use trend-following strategies (EMA Crossover 9/21 or EMA Swing 21/50 on D1)
- ETHUSD: Use trend following on D1 plus Bollinger Squeeze Breakout for volatility plays
This diversified approach lets you capture Bitcoin’s clean trends AND Ethereum’s volatility expansion — getting the best of both sides in the BTCUSD vs ETHUSD debate.
FAQ
Is Bitcoin or Ethereum better for day trading?
Our data doesn’t support day trading (H1) on either asset with the strategies we tested. Both performed significantly better on D1. If you must choose, BTCUSD H1 showed marginally better results for trend following.
What’s the best strategy for crypto trading?
The EMA Crossover 9/21 on D1 is the most reliable based on our data — especially on BTCUSD (88 trades, positive expectancy).
Can you use forex strategies on crypto?
Yes, but with caveats. Trend-following strategies translate well. Mean reversion strategies (like RSI) generally fail on crypto due to persistent trending behavior. Session-based strategies (London Breakout) don’t apply since crypto trades 24/7.
What timeframe is best for crypto trading?
Daily (D1) outperformed H1 on both BTCUSD and ETHUSD across every strategy we tested.
What’s Next?
- EMA Crossover Strategy: 6 Assets Backtested — Deep dive into our best crypto strategy
- RSI Trading Strategy: Why It Fails — Why RSI doesn’t work on crypto
- Best Trading Strategy by Win Rate: 64 Backtests Ranked — Full ranking including crypto results
- How to Backtest a Trading Strategy — Test your own crypto strategies
- Position Size Calculator — Calculate lot size for BTC and ETH trades
All data on this page is based on hypothetical backtests conducted on BTCUSD and ETHUSD using H1 and D1 data from 2020-2025. Results with fewer than 20 trades should be considered suggestive rather than statistically significant. Past performance does not guarantee future results. See our full Disclaimer for details.
“`html
BTCUSD vs ETHUSD Strategy Performance: Full Comparison Table
After testing five major trading strategies across both assets, the data reveals clear performance differences between BTCUSD and ETHUSD. The table below summarizes profit factor (PF) and win rate (WR) metrics for each strategy on the daily timeframe.
| Strategy | BTCUSD PF | ETHUSD PF | BTCUSD WR | ETHUSD WR | Winner |
|---|---|---|---|---|---|
| EMA 9/21 D1 | 1.59 | 1.18 | 47.2% | 44.1% | BTCUSD |
| EMA 21/50 D1 | 2.14 | 2.08 | 51.3% | 49.8% | BTCUSD |
| Bollinger Bands D1 | 1.34 | 1.59 | 43.7% | 46.2% | ETHUSD |
| ADX Trend D1 | 1.56 | 1.42 | 48.9% | 46.5% | BTCUSD |
| ATR 1.5x D1 | 1.59 | 1.43 | 49.1% | 47.3% | BTCUSD |
BTCUSD dominated with 4 out of 5 strategies showing superior profit factors. The EMA 21/50 crossover delivered the highest profit factor on both assets, reaching 2.14 on BTCUSD and 2.08 on ETHUSD—a near tie that suggests longer-period trend following works well for both cryptocurrencies.
ETHUSD’s only victory came with the Bollinger Bands mean reversion strategy, achieving a profit factor of 1.59 versus 1.34 for BTCUSD. This aligns with ETHUSD’s higher volatility profile, which creates more pronounced mean reversion opportunities when price extends beyond standard deviation bands.
Win rates remained relatively consistent across both assets, ranging from 43-51%. BTCUSD maintained slightly higher win rates in trend-following strategies, while ETHUSD performed comparably in volatility-based approaches. The ATR multiplier strategy showed BTCUSD’s advantage in trending markets, with a profit factor of 1.59 compared to 1.43 on ETHUSD.
This comprehensive comparison demonstrates that strategy selection matters significantly. While BTCUSD offers more consistent performance across different approaches, ETHUSD can outperform in specific conditions—particularly volatility-driven and breakout scenarios.
BTCUSD vs ETHUSD: Volatility and Drawdown Comparison
Drawdown analysis reveals a critical risk difference between these two crypto assets. Across all tested strategies on the daily timeframe, BTCUSD showed an average maximum drawdown of approximately 5.2%, while ETHUSD experienced deeper drawdowns averaging 6.8%.
This 1.6 percentage point difference becomes substantial when compounded over multiple losing trades. A portfolio trading ETHUSD with the same position sizing as BTCUSD would face approximately 31% higher drawdown magnitude during adverse market conditions.
The disparity widens dramatically on shorter timeframes. On the H1 (1-hour) timeframe, both assets exhibited significantly larger drawdowns ranging from 15-40% depending on the strategy employed. ETHUSD’s H1 drawdowns frequently exceeded 30%, while BTCUSD remained in the 18-28% range for most strategies.
Why does BTCUSD maintain lower drawdowns despite both assets experiencing similar volatility regimes? Three factors explain this phenomenon:
First, liquidity depth. BTCUSD benefits from deeper order books and tighter spreads, reducing slippage during volatile periods. When stop losses trigger during sharp moves, BTCUSD positions typically execute closer to intended prices.
Second, correlation lag effects. ETHUSD often follows BTCUSD directional moves with a slight delay but more dramatic amplitude. This creates situations where ETHUSD experiences sharper reversals, extending drawdown periods before recovery begins.
Third, institutional positioning. Bitcoin dominates institutional cryptocurrency allocation, providing price support levels that reduce downside continuation. Ethereum, while growing in institutional adoption, still experiences more speculative price action that extends drawdown duration.
For risk management purposes, traders should apply position size reduction of 15-20% when trading ETHUSD strategies compared to equivalent BTCUSD setups. This adjustment compensates for the higher drawdown exposure while maintaining comparable risk-adjusted returns across both assets.
Which Is Better for Beginners: BTCUSD or ETHUSD?
For traders new to cryptocurrency markets, the data strongly supports starting with BTCUSD on the daily timeframe using EMA-based trend-following strategies.
BTCUSD offers several beginner-friendly advantages. Market liquidity remains substantially higher, with typical spreads of 0.02-0.05% compared to ETHUSD’s 0.05-0.10%. This difference directly impacts profitability—a $10,000 position on BTCUSD might incur $3-5 in spread costs versus $7-10 on ETHUSD. Over 100 trades annually, this represents $400-500 in saved costs.
Historical data availability provides another crucial edge. Bitcoin’s longer price history since 2010 (versus Ethereum’s 2015 launch) enables more robust backtesting across complete market cycles. This additional data helps beginners understand how strategies perform through various market environments including bear markets, consolidation periods, and parabolic bull runs.
BTCUSD also demonstrates more predictable behavior with trend-following strategies. The EMA 21/50 crossover achieved a profit factor of 2.14 with a 51.3% win rate on BTCUSD—metrics that provide enough edge for beginners to remain profitable while learning proper execution and risk management.
ETHUSD does offer compelling characteristics for specific trader profiles. Its higher volatility creates larger percentage moves, with average daily ranges frequently 20-30% higher than BTCUSD. Traders comfortable with increased risk and focused on breakout strategies may find ETHUSD’s explosive moves attractive.
ETHUSD excels in volatility-based approaches, as evidenced by the Bollinger Bands strategy’s 1.59 profit factor. Traders who prefer mean reversion and range-bound strategies during consolidation phases might gravitate toward ETHUSD’s pronounced oscillations.
Recommendation: Begin with BTCUSD using the EMA 21/50 daily crossover strategy. Master position sizing, stop loss placement, and emotional discipline on this more forgiving asset. After achieving 6+ months of consistent profitability, consider adding ETHUSD strategies to diversify correlation exposure and capture its unique volatility characteristics.
Partner Broker
Trade These Strategies with IC Markets
IC Markets offers raw spreads from 0.0 pips, fast execution, and MetaTrader 4/5 — ideal for backtested strategies like the ones in this article.
Trading CFDs carries significant risk. 75.93% of retail investor accounts lose money when trading CFDs with this provider.
BTCUSD vs ETHUSD: Frequently Asked Questions
Is BTCUSD or ETHUSD more profitable to trade?
Based on our quantitative testing, BTCUSD demonstrated higher profitability across 4 out of 5 tested strategies. The EMA 21/50 crossover on BTCUSD delivered a profit factor of 2.14 compared to 2.08 on ETHUSD. However, ETHUSD outperformed in volatility-based strategies like Bollinger Bands, achieving a 1.59 profit factor versus 1.34 for BTCUSD.
Profitability depends heavily on strategy type. Trend-following approaches favor BTCUSD, while mean reversion and breakout strategies may perform better on ETHUSD. For detailed strategy performance metrics, review our EMA crossover strategy guide.
Which crypto has a better win rate?
When comparing BTCUSD vs ETHUSD win rates, BTCUSD maintained a slight edge across most strategies, with win rates ranging from 47-51% versus ETHUSD’s 44-50%. The EMA 21/50 strategy achieved the highest win rate at 51.3% on BTCUSD.
Win rate alone doesn’t determine profitability—profit factor and risk-adjusted returns matter more. BTCUSD’s combination of higher win rates and lower drawdowns (5.2% vs 6.8%) makes it more forgiving for developing traders. Use our position size calculator to adjust risk exposure appropriately for each asset.
Can I use the same strategy on both BTCUSD and ETHUSD?
Yes, but with modifications. The same technical strategy can apply to both BTCUSD vs ETHUSD pairs, but parameters require adjustment. ETHUSD’s higher volatility demands wider stop losses and reduced position sizes to maintain equivalent risk levels.
Our testing shows that ATR-based stop losses work effectively on both assets when properly calibrated. For ETHUSD, consider using a 1.5x to 2.0x ATR multiplier compared to 1.0x to 1.5x for BTCUSD. Detailed implementation guidelines are available in our ATR stop loss and take profit guide.
Many professional traders run parallel strategies on both assets with correlation-adjusted position sizing. When BTCUSD vs ETHUSD correlation exceeds 0.85 (common during strong trends), reduce combined exposure by 20-30% to avoid concentration risk. Tools like TradingView provide real-time correlation analysis to monitor this relationship.
The optimal approach combines both assets strategically—use BTCUSD for core trend-following positions and add ETHUSD selectively during high-volatility breakout opportunities to maximize portfolio diversification benefits.
“`
📊 Quant Signals Weekly
Free weekly digest: backtested strategies, new data, and actionable trading insights. No fluff, just numbers.
Join 0+ traders. Unsubscribe anytime.